What is a Forex Volatility Indicator
Data is continually updated by our staff and systems.
Last updated: 14 Apr 2020
We earn commissions from some affiliate partners at no extra cost to users (partners are listed on our ‘About Us’ page in the ‘Partners’ section). Despite these affiliations, our content remains unbiased and independent. We generate revenue through banner advertising and affiliate partnerships, which do not influence our impartial reviews or content integrity. Our editorial and marketing teams operate independently, ensuring the accuracy and objectivity of our financial insights.
Read more about us ⇾
Volatility indicators reveal the size and magnitude of price fluctuations, providing insight into the level of market activity. Markets fluctuate between periods of high volatility and low volatility, with a period of low volatility gradually increasing in intensity, and a period of high volatility gradually diminishing in intensity to become low volatility.
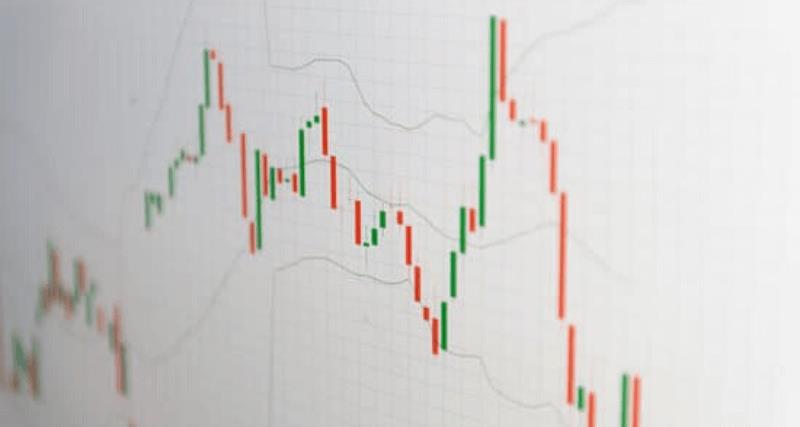
For instance, one of the most popular of volatility indicators, the Bollinger Band, measures volatility via the bands (2 standard deviations of the 20 SMA): the bands expand when volatility is rising, and contract when it is falling. Over the years, traders have figured out different ways of trading off the indicator. Some choose to trade the breakout: buying (selling) the breakout (breakdown) of pricing crossing over (under) the upperband (lowerband). Others choose to trade the reversal bounce: buying (selling) the bounce of prices crossing under (over) the upperband (lowerband).
| Trend Indicator | Relevance |
|---|---|
| Bollinger Bands | The most popular volatility indicator |
Bollinger Bands
Bollinger Bands are one of the most popular technical indicators in any financial market, including Forex They are most often used to determine overbought and oversold levels, selling when price touches the upper Bollinger Band and buying when it bounces off the lower Bollinger Band. Bollinger Bands consist of a set of three bands drawn in relation to price: there is the 20-period moving average in the middle, with an upper and lower band of two standard deviations above and below the simple moving average. We are discussing this topic in more details in our article: Bollinger Bands.


